
Dates are an important piece of data that might influence your analysis. As a result, creating a date-time column in Power BI is critical to ensure the accuracy of your data analysis process and assist you in optimizing your report. The precise date and time data may give useful insights when looking at sales numbers, financial records, consumer behavior, customer feedback, or website traffic. This is where your Power BI date table can help. So, let’s look at why a date table is important in Power BI and how to create one.
What’s Date Table & Why Do You Need It?
A Date Table is a dimension data table that contains date attributes such as year, month, and day. Each day in this table has one value, which is a date. As a result, date tables are sometimes known as calendar tables. A date table is required to analyze Power BI data for numerous reasons.
- For the analysis of time intelligence data.
- Use dates as references and filters in your models.
- To create reports that need date-specific information.
- For data modeling, ensure that all dates accessible in your data have a centralized and precisely structured date. This is analogous to using a data model in Excel to create connections between different tables.
- To create visually informative graphics.
- It ensures that your reports have a constant and defined date.
Date Table Requirements
There are a few things to remember while creating a date table in Power BI.
- Dates of the date/time date type should be in the first column, which is your date column.
- The first column’s date values must be unique and include no blanks.
- Once your date table has been created as a Date Table, mark it.
- The date should not have missing values and should include all dates within a period. This might range from a few months to a year or more.
How To Create Date Table Using Auto Date/Time?
The Auto Date tool in Power BI automatically produces a date and date hierarchy table depending on the fields in your data. This date is also updated depending on your underlying data. Depending on a given date or time, you may dig down, aggregate, and filter your data using the hierarchy it provides. To activate the Auto date function.
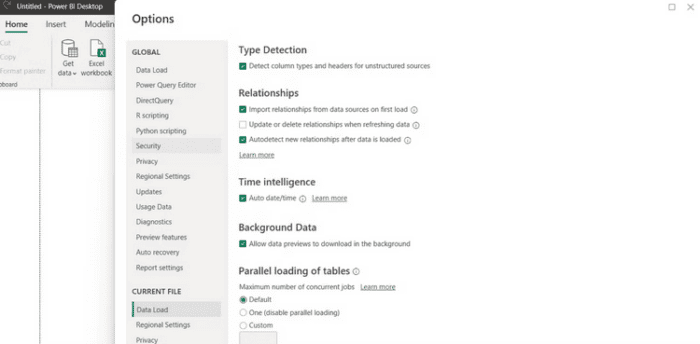
- Go to the File ribbon and then Options & Settings.
- Then select Options > Current File > Data Load > Time Intelligence from the menu.
- Select the Enable Auto date/time checkbox.
The date hierarchy will consist of Year, Quarter, Month, and Day.
How To Create Date Table Using DAX?
Power BI’s Data Analysis Expression (DAX) functions are one feature that distinguishes it from Microsoft Excel. While DAX may be used in Excel, it could be more obvious in the application. These tables are created using the DAX functions CalendarAuto and Calendar. The only difference between the two functions is that Calendar creates dates based on what you provide, while CalendarAuto creates dates based on what it automatically identifies from your data. To make advantage of the Calendar function.
- Navigate to the Home Tab on the ribbon of Power BI Desktop.
- Choose New Table
- Enter the DAX formula below. This formula will create a date table from Jan 1st, 2022, to Dec 31st, 2023.
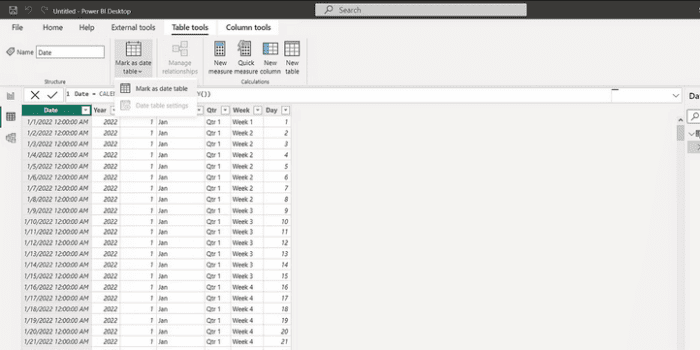
Date = CALENDAR(DATE(2022,1,1), DATE(2023,12,31))- To make it self-increment, replace the ending date with TODAY(), as seen below.
Date = CALENDAR(DATE(2022,1,1),TODAY())- To add a Year column, select the New column and write this DAX function using the YEAR() function.
Year = YEAR('Date'[Date])- Select the New column and enter the MONTH() DAX function to add a month column. This function, on the other hand, writes the month in numerical format.
Month = MONTH('Date'[Date])- Use the FORMAT() function to create a categorical function.
Month Cat = FORMAT('Date'[Date],"MMM")- Using the Sort By Column option would be best to sort your month Cat column by the Month column.
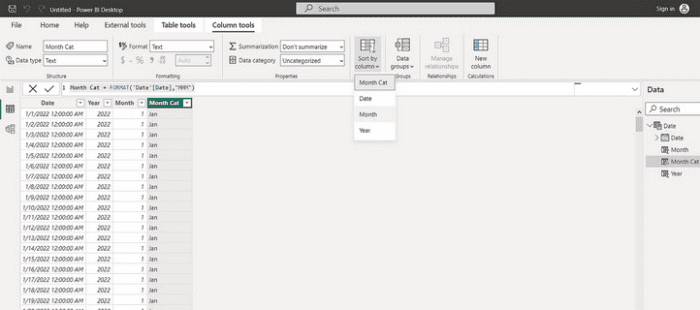
- The DAY() function may be used to create a day column.
Day = DAY('Date'[Date])- The WEEKNUM() function returns the week in which our dates fall.
Week = "Week " & WEEKNUM('Date'[Date])- The QUARTER() function returns the current quarter.
Qtr = "Qtr " & QUARTER('Date'[Date])How To Create Date Table Using Advanced DAX?
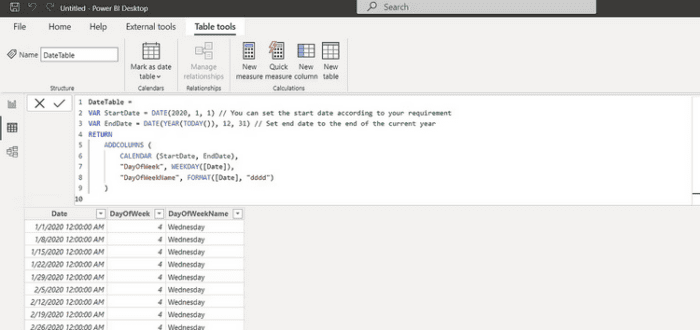
If you’re comfortable with DAX, you can speed up the date table creation. You may write your table without manually creating additional columns by using functions like VAR, ADDCOLUMNS, and FORMAT. Here’s a script from Enterprise DNA specialists that demonstrates creating a basic date table without creating extra columns.
DateTable =
VAR StartDate = DATE(2020, 1, 1) // You can set the start date according to your requirement
VAR EndDate = DATE(YEAR(TODAY()), 12, 31) // Set end date to the end of the current year
RETURN
    ADDCOLUMNS (
        CALENDAR (StartDate, EndDate),
        "DayOfWeek", WEEKDAY([Date]),
        "DayOfWeekName", FORMAT([Date], "dddd")
    )
Here’s how to put this script to use.
- Choose New Table
- Then copy & paste the DAX script above.
How To Your Table As A Date Table?
It would be best to mark the newly created table as a date table once you have created it. This is the last stage in the creation of a date table. You can do this by.
- In the Field pane, right-click the table name.
- Choose Mark as a date table.
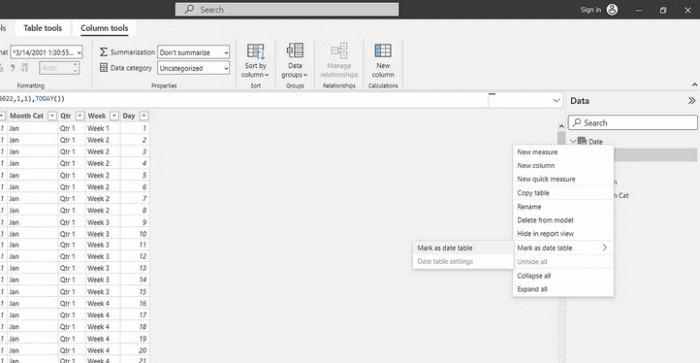
- You can also choose the Mark as date table option on the Power BI ribbon.
- Choose the date option.
- Choose Ok.
Conclusion: Create Date Table In Power BI
Dates are a vital component of any analysis, regardless of business. As a result, you must have a centralized and uniform date table to reach your aim. With this information, you may construct and adapt your date table to meet your company’s and data project’s needs.